

Financial performance
Your Financial Index
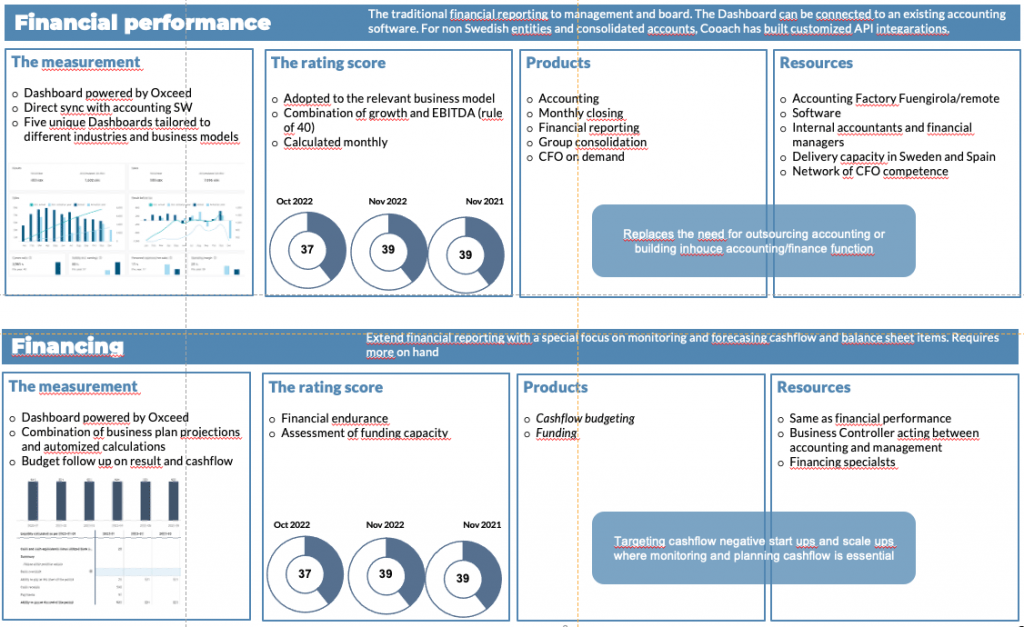
The traditional financial reporting to management and board. The Dashboard can be connected to an existing accounting software. For non Swedish entities and consolidated accounts, Cooach has builtcustomized API integarations.
Organization number: XXXXXX-XXXX
Name: Company (publ) AG
Adress: Street, City, Postal Code
Result
EBITDA-Growth-index (Rule of 40)
Adopted to the relevant business model • Combination of growth and EBITDA (rule of 40) • Calculated monthly
Above: Spreadsheet located in Cooach Google Drive account connected to the graph. With actual data from a real company this is fairly easy to complete.
Below: the layout from Jonas Melchersons and C-F Moranders initial sketches. Maybe not the best idea after all. It requires 3 separate loading of data and these spreadsheets are probably more suited to have months in columns in the same spreadsheet anyway. (Manual data to illustrate the issue)
No Data Found
No Data Found
No Data Found
No Data Found
Act on this Powerpoint mockup
On this page we need to act on what is suggested in the image.
I see C-F’s image here as a story board for a project manager to realize.
1. the measurement (google spread sheet)
2. what to display (HTML interface, not always as doughnuts, can be other layouts)
3. Products that can have relevant data (where to dig)
4. Who to use as a resource for the mini-project. (who to ask)
// Jonas
- Get data from Oxceed (a side project).
- Find out what from our own products that can be turned into relevant data.
- What does ”Five different Finance dashboards, tailored on different industries and business models” mean for a dashboard of finance graphs? Customized view per logged in client?
- These two sets of data (Finance performance and Financing) are suited to be visible together, how to lay the page depends on the choice of chart layout.
- The rating score, Cool stuff, but we, the digitalization team need help with calculating these ratings from actual business data. The good news is that the calculation and ending up on these numbers are pure excel now.
...to be continued
Now we have dynamic connections between Google Spreadsheets located in Cooach Google Drive account connected to graphs on this page.
• All Google sheets have a tab with published data and a second tab for raw data and calculations.
• To populate the published (first) sheet with curated numbers from to the second sheet in the same document is easy.
The hard work that still has to be put in is to:
1. Fill the spreadsheets with real and relevant data.
2. Decide if we want to build a web form to submit data to the spreadsheets or if we want to control the data from Cooach side.
Let the creativity flow! Connection is established. Now we can display all kind of data as doughnuts, pies, lines, fields-lines, 3D, Gauge, Radial, Nested, Radial and other kinds of charts.
// Jonas