

HR Performance
Your HR Index
Description
Organization number: XXXXXX-XXXX
Name: Company (publ) AG
Adress: Street, City, Postal Code
Act on this Powerpoint mockup
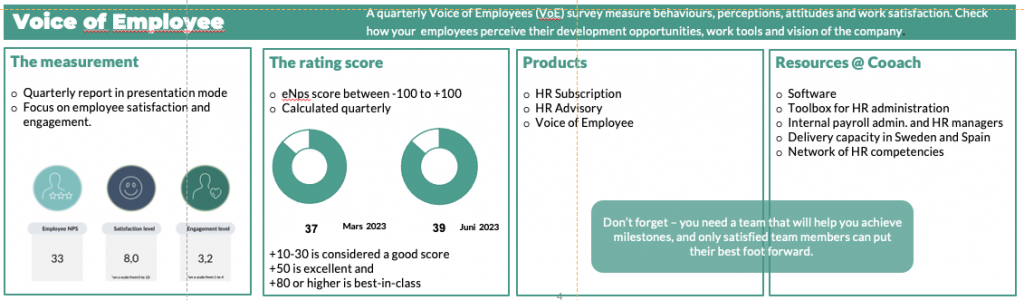
On this page we need to act on what is suggested in the image.
I see C-F’s image here as a story board for a project manager to realize.
1. the measurement (Google spread sheet)
2. what to display (HTML interface, not always as doughnuts, can be other layouts)
3. Products that can have relevant data (where to dig)
4. Who to use as a resource for the mini-project. (who to ask)
// Jonas
...to be continued
Now we have dynamic connections between Google Spreadsheets located in Cooach Google Drive account connected to graphs on this page.
• All Google sheets have a tab with published data and a second tab for raw data and calculations.
• To populate the published (first) sheet with curated numbers from to the second sheet in the same document is easy.
The hard work that still has to be put in is to:
1. Fill the spreadsheets with real and relevant data.
2. Decide if we want to build a web form to submit data to the spreadsheets or if we want to control the data from Cooach side.
Let the creativity flow! Connection is established. Now we can display all kind of data as doughnuts, pies, lines, fields-lines, 3D, Gauge, Radial, Nested, Radial and other kinds of charts.